The ability to express systems (in my case, usually software) in terms of a few salient diagrams is an invaluable tool for cutting through unnecessary detail and getting right at the heart of the ‘big picture’. I tried very hard to adopt UML (it is, after all, universal) but for whatever reason I was never able to make it make sense to me. Over the years, I've developed an alternate graphical syntax for system modeling. I personally find this syntax very intuitive and easy to understand.
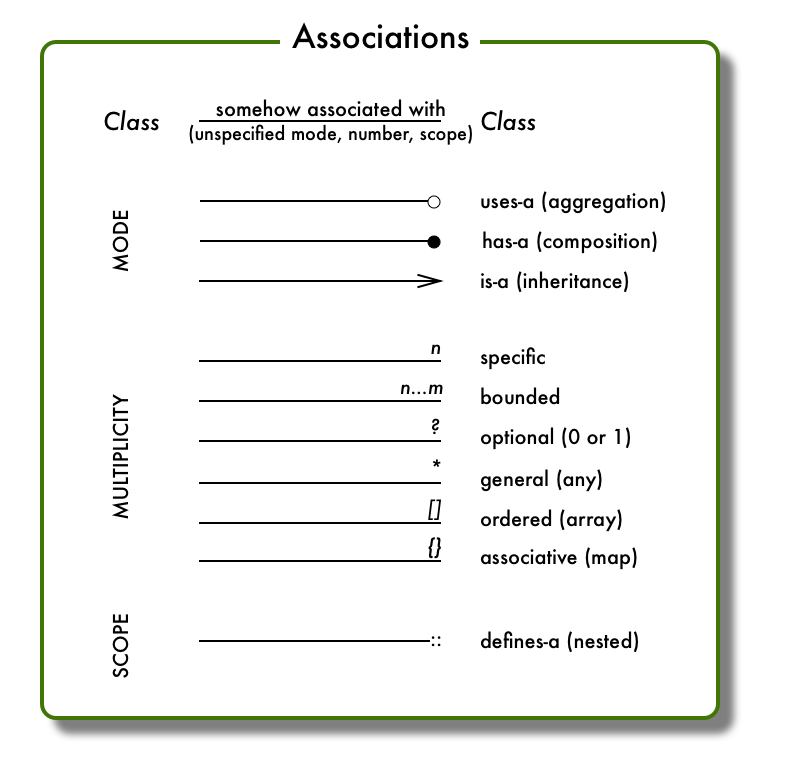
Associations between (instances of) classes are indicated by lines that are mostly straight. Without any adornment the association is vague, specifying nothing. A bubble at one end establishes that instances at the other end use instances at the bubble (referent) end; a solid bubble indicating that referent instances are ‘owned’ (i.e., their lifetimes controlled) by the owner end. The arrow indicates a subtype/inheritance relationship with the supertype on the arrow end (note that this is opposite to how UML shows it).
In the diagram the ‘adornments’ happen all to be on the right side; obviously, depending on the needs of the diagram, they can be on the left, top or bottom of a vertical line; or on both ends of the line, indicating bilateral aspects of the association.
In addition, the multiplicity of the asssociation may be indicated; if not, it is unspecified. These are mostly self-explanatory, except the ‘ordered’ multiplicity indicates some kind of array or vector kind of ordering. Similarly, the ‘associative’ multiplicity depicts some kind of map or associative array. In either of these two, the type of the index/key could be written inside the brackets or braces, if necessary.
Finally, the scope adornment can be used to indicate nesting of the classes, used when the type of the referent side has specific meaning inside the context of the owner side.
Posted on 2017/11/20